2022 Police Violence Report →
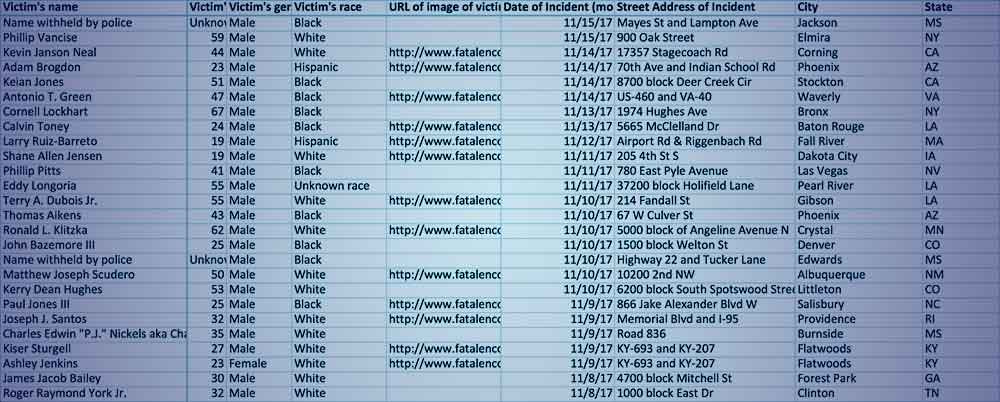
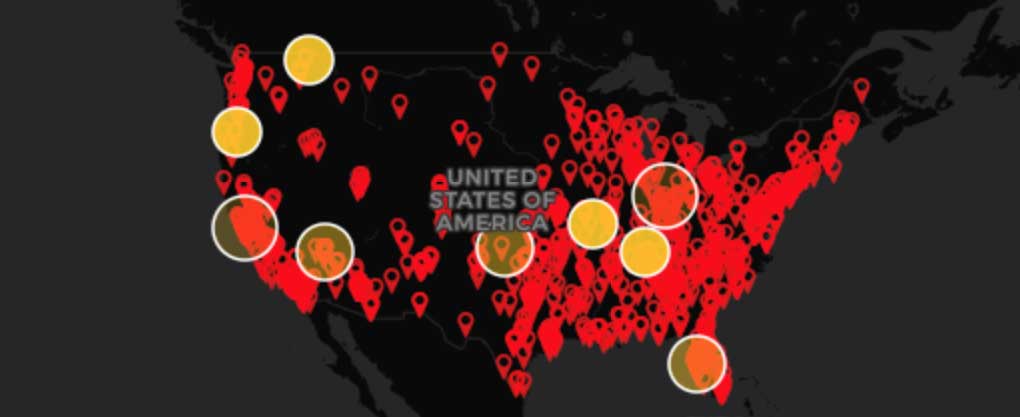
Mapping Police Violence collected data on nearly 1,200 killings by police in 2022. We compiled this information from media reports, obituaries, public records, and databases like The Gun Violence Archive and the Washington Post. As such, this report represents the most comprehensive public accounting of deadly police violence in 2022. Our analysis suggests a substantial proportion of all killings by police in 2022 could have been prevented and that specific policies and practices might prevent police killings in the future.
Scroll to explore the findings.
people were killed by police in 2022.
More people were killed by police in 2022 than any other year in the past decade.
of people killed by police in 2022 were killed by police shootings. Tasers, physical force, and police vehicles accounted for most other deaths.
Officers were charged with a crime in only of these cases. One percent of all killings by police.
Each year, fewer than 3% of killings by police result in officers being charged with a crime. Officers are disproportionately prosecuted by Black prosecutors — especially Black women. Representing only 1% of the nation’s elected prosecutors, Black women were 9% of prosecutors who charged officers for killing someone, 11% of prosecutors convicting officers and 19% of prosecutors charging officers in two or more deadly force incidents from 2013-2022.
We were able to identify officers in cases. At least had shot or killed someone before. had multiple prior shootings.
Most killings began with police responding to suspected non-violent offenses or cases where no crime was reported. people were killed after police stopped them for a traffic violation.
Suspected non-violent offense or no reported crime ()
In February 2021, the City of Berkeley enacted a new policy meant to restrict police from enforcing some traffic violations, including equipment violations like expired tags or tinted windows. While stops for equipment violations have declined since then, overall police traffic enforcement has not reduced substantially – indicating the need for more expansive restrictions on police traffic enforcement.
people were killed after police responded to reports of someone behaving erratically or having a mental health crisis.
Many cities expanded programs in 2022 that send mental health providers instead of police to mental health-related 911 calls. These programs show that a substantial proportion of mental health calls can be responded to safely without the need for police involvement:
|
|
Portland: Street Response Teams expanded citywide in 2022 and responded to 19% of unwanted persons calls and non-emergency welfare checks. 96% of responses did not involve police. |
|
|
San Francisco: Street Crisis Response Teams expanded citywide and responds to 58% of all mental health-related calls. 97% of responses did not involve police. |
|
|
Denver: STAR program expanded citywide and responded to 48% of welfare check, trespassing and unwanted persons calls flagged by dispatchers. 100% of responses did not involve police. |
people killed by police were unarmed.
Most unarmed people killed by police were people of color.
Black people were more likely to be killed by police, more likely to be unarmed and less likely to be threatening someone when killed.
Police disproportionately kill Black people, year after year.
people killed by police had a vehicle as a weapon.
of these people were killed when police shot at a moving vehicle, a practice many experts say should be banned.
Experts, law enforcement groups, and the US Department of Justice recommend that police be banned from shooting at people in moving vehicles. These shootings are particularly ineffective and dangerous, since shooting the driver can make the vehicle an uncontrollable threat to both officers and the public.
Despite this, most police departments continue to allow officers to shoot people in these situations.
people killed by police were allegedly armed with a knife.
In many countries, police routinely disarm people who have knives without shooting them.
In the United Kingdom, a country of 67 million people where police encounter knife attacks at a similar rate as US police, police fatally shot 3 people in 2022, 2 of whom allegedly had knives.
In Los Angeles County, with a population of 10 million, law enforcement officers fatally shot 12 people allegedly armed with knives in 2022.
Half of those killed by police were reportedly armed with a gun.
But 1 in 6 people with a gun were not threatening anyone when they were killed. They might have been de-escalated instead.
% of killings by police in 2022 — deaths — were traffic stops, police responses to mental health crises, or situations where the person was not reportedly threatening anyone with a gun. Creating alternatives responses to these situations could substantially reduce this violence nationwide.
Which would mean substantially fewer people killed by police in almost every city.
The 2022 Police Violence Report was built by Mapping Police Violence Inc, a 501(c)3 nonprofit organization.
Data & Design Team:
Samuel Sinyangwe
Mary Hammond
Justin Hall
John Emerson
Davon Wheeler
Ashtaan Rapanos
Oriana Ballardo
Email us with inquiries or suggested additions to our database.