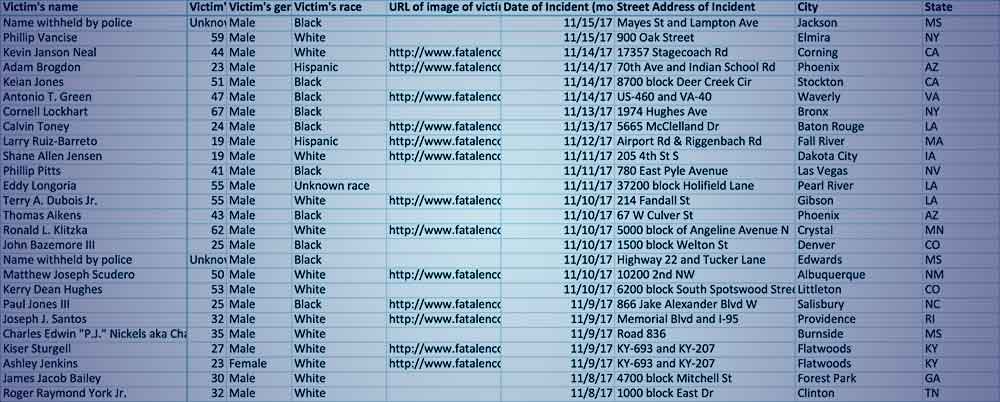
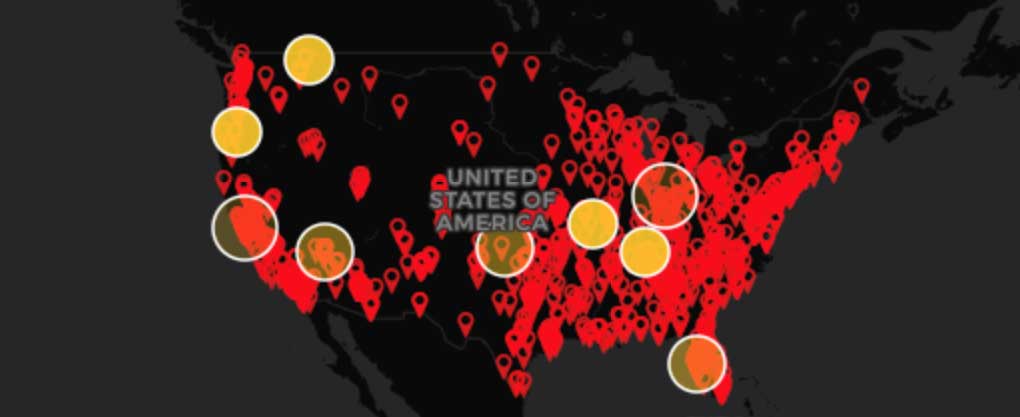
Mapping Police Violence collected data on more than 1,200 killings by police in 2025. We compiled this information from media reports, obituaries, public records, and databases like The Gun Violence Archive. As such, this report represents the most comprehensive public accounting of deadly police violence in 2025. Our analysis suggests a substantial proportion of all killings by police in 2025 could have been prevented and that specific policies and practices might prevent police killings in the future.
Scroll to explore the findings.
At least people were killed by police in 2025.
The total number of killings by police declined slightly in 2025 compared to record highs reported in 2024, but remained higher than pre-pandemic levels.
Alaska had the highest rate of killings by police of any state per population in 2025. Killings by police in Alaska have risen substantially over the past decade.
of people killed by police in 2025 were killed by police shootings. Tasers, physical force, and police vehicles accounted for most other deaths.
Officers were charged with a crime in only of these cases. Less than one percent of all killings by police.
Each year, fewer than 3% of killings by police result in officers being charged with a crime. Officers are disproportionately prosecuted by Black prosecutors — especially Black women. Representing only 1% of the nation’s elected prosecutors, Black women were 8% of prosecutors who charged officers for killing someone, 9% of prosecutors convicting officers and 16% of prosecutors charging officers in two or more deadly force incidents from 2013-2025.
We were able to identify officers in cases. At least had shot or killed someone before.
Police deployed drones or robots against at least 24 people who they subsequently killed in 2025. Police used drones and robots to enter buildings, locate individuals, determine whether people were armed, and to deliver items during barricade situations. In at least 4 of these situations, the person allegedly shot at or disabled the drone before being killed by police.
Most killings began with police responding to suspected non-violent offenses or cases where no crime was reported. people were killed after police stopped them for a traffic violation.
Suspected non-violent offense or no reported crime ()
Most traffic stop-related killings by police involved police vehicle pursuits. In 2025, Hawaii enacted a law (HB227) restricting police vehicle pursuits to only situations involving serious offenses, such as felonies involving physical injury, kidnapping, sex offenses, or driving under the influence. The law also bans police from shooting at, or from, moving vehicles under most circumstances.
people were killed after police responded to reports of someone behaving erratically or having a mental health crisis.
At least 25 states had official data collection and/or reporting requirements in effect for police use of force in 2025. But many states do not require their databases to be made publicly accessible, and even when the data is made public it’s often incomplete.
people killed by police were unarmed.
Most unarmed people killed by police were people of color.
Black people were more likely to be killed by police, more likely to be unarmed and less likely to be threatening someone when killed.
Police disproportionately kill Black people, year after year.
people killed by police had a vehicle as a weapon.
of these people were killed when police shot at a moving vehicle, a practice many experts say should be banned.
Experts, law enforcement groups, and the US Department of Justice recommend that police be banned from shooting at people in moving vehicles. These shootings are particularly ineffective and dangerous, since shooting the driver can make the vehicle an uncontrollable threat to both officers and the public.
Despite this, most police departments continue to allow officers to shoot people in these situations.
people killed by police were allegedly armed with a knife.
In many countries, police routinely disarm people who have knives without shooting them.
In the United Kingdom, a country of 69 million people where police encounter knife attacks at a similar rate as US police, police fatally shot 2 people with knives in 2025.
In California, with a population of 39 million, law enforcement officers fatally shot at least 32 people allegedly armed with knives in 2025.
Half of those killed by police were reportedly armed with a gun.
But 1 in 6 people with a gun were not threatening anyone when they were killed. They might have been de-escalated instead.
% of killings by police in 2025 — deaths — were traffic stops, police responses to mental health crises, or situations where the person was not reportedly threatening anyone with a gun. Creating alternatives responses to these situations could substantially reduce this violence nationwide.
Which would mean substantially fewer people killed by police in almost every city.
The 2025 Police Violence Report was built by Mapping Police Violence Inc, a 501(c)3 nonprofit organization.
Data & Design Team:
Samuel Sinyangwe
Ariel Matos
John Emerson
Email us with inquiries or suggested additions to our database.